Jorge Zarta | Senior BI Analyst
You have the Data. I find the Story!
Behind every smart business decision is someone who knew what the numbers were really saying. That's what I do. I'm Jorge Zarta - I turn complex data into clear stories that help marketing, operations, and leadership teams move with confidence.
M.Sc. in Business Intelligence | Valedictorian | SAFe Certified Agilist


Power BI Portfolio
From financial KPIs to market intelligence, a showcase of interactive dashboards built in Power BI across multiple industries and analytical domains.

01
Retail Sales & Gross Profit Dashboard
An executive-level retail dashboard tracking $31M in total revenue across product lines, store managers, and payment types.
Features dynamic state filtering across:
-
Arizona
-
California
-
Nevada
Geographic heat mapping:
-
Zip code
-
Dual-axis visualizations
The goal was to combining gross profit dollars with margin percentage. Built to help leadership identify top-performing products and underperforming managers at a glance.
02
Competitive Market Analysis — VanArsdel
A market intelligence dashboard tracking revenue performance across 5 competing manufacturers over 7 years. Combines:
-
Geographic revenue by country
-
Year-over-year growth trends
-
Segment-level breakdowns across:
-
Urban
-
Rural
-
Mix categories
-
Designed for marketing leadership to monitor competitive positioning and identify growth opportunities by region and segment.


03
Manufacturer Revenue & Growth Analysis
An advanced drill-down dashboard with expandable category hierarchies; from Urban/Rural segments down to individual product lines. Features prior year sales comparison, automated narrative insights, and revenue trend analysis from 2014–2021. Built for executives who need both the big picture and the ability to drill into the detail without switching reports.
04
VanArsdel KPI & Revenue Scorecard
A focused KPI dashboard tracking $1B+ in revenue across 7 countries with gauge visualization for revenue vs. target, animated date playback, and Urban vs. Rural category breakdown. The drill-down table allows leadership to expand category performance with inline bar charts and percentage-of-total comparisons, all filterable by manufacturer.

05
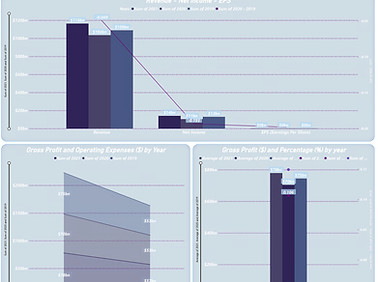
Comcast Multi-Year Financial Performance
A comprehensive financial dashboard combining stock trends, income statement analysis, and year-over-year percentage growth across Revenue, Gross Profit, Net Income, and EPS from 2019–2022. Features a chord diagram showing financial metric relationships and a stock market price range overlay.
Built to give CFO-level visibility across both market performance and fundamental financials in a single view.